Last updated 1pm 20 January 2021.
All data on this page is as at 9:00am on 20 January 2021 unless otherwise stated.
Change to the updating schedule for this page
Data on this page is now updated four times per week: Monday, Wednesday, Friday, and Sunday. Media updates are issued on the same days.
Data is collected from the EpiSurv database (administered by ESR) unless otherwise stated.
On this page:
Current situation
| New cases reported during the past 48 hours | 6 | |
|---|---|---|
| Active cases | At the border | 76 |
| In the community | 0 | |
| Under investigation/other | 0 | |
| Total | 76 | |
| Most recent case reported | 20 January 2021 | |
| Most recent case reported due to community transmission (spread within our communities) | 18 November 2020 | |
| COVID-19 cases | Change in last 48 hours | Total |
|---|---|---|
| Active | -9 | 76 |
| Recovered | 14 | 2166 |
| Deceased | 0 | 25 |
Case details
| Change in last 48 hours | Total at present | Total since first NZ case | |
|---|---|---|---|
| Confirmed | -9 | 76 | 1911 |
| Probable | 0 | 0 | 356 |
| Total | -9 | 76 | 2267 |
| Change in last 48 hours | Total at present | |
|---|---|---|
| In managed facilities | -9 | 76 |
| In hospital (not ICU) | 0 | 0 |
| In ICU | 0 | 0 |
| At home or in self-isolation | 0 | 0 |
| Not in isolation | 0 | 0 |
| Unknown | 0 | 0 |
| Change in last 48 hours | Total at present | |
|---|---|---|
| People who travelled internationally and were diagnosed in managed facilities at the border | -9 | 76 |
| People in close contact with someone who caught COVID-19 while overseas | 0 | 0 |
| Caught COVID-19 from someone locally | 0 | 0 |
| Caught COVID-19 within NZ, but source is unknown | 0 | 0 |
| Under investigation | 0 | 0 |
| Active case – confirmed | Confirmed cases are people that have been tested, and the test confirms they have COVID-19 (ie, a positive test). For more details, see the COVID-19 case definition. |
|---|---|
| Active case – probable | A probable case is when someone is diagnosed based on their exposure to other people with COVID-19 and on their symptoms. |
| In managed facilities | In managed isolation or quarantine facilities; hospitalisation not needed |
| Recovered | Recovered cases are people who had the virus, where at least 10 days have passed since their symptoms started and they have not had symptoms for 72 hours, and they have been cleared by the health professional responsible for their monitoring. |
More information
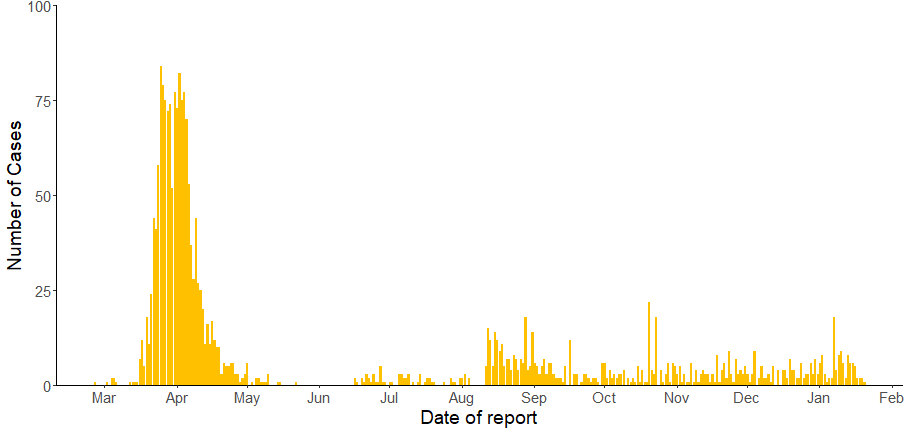
Cases reported each day
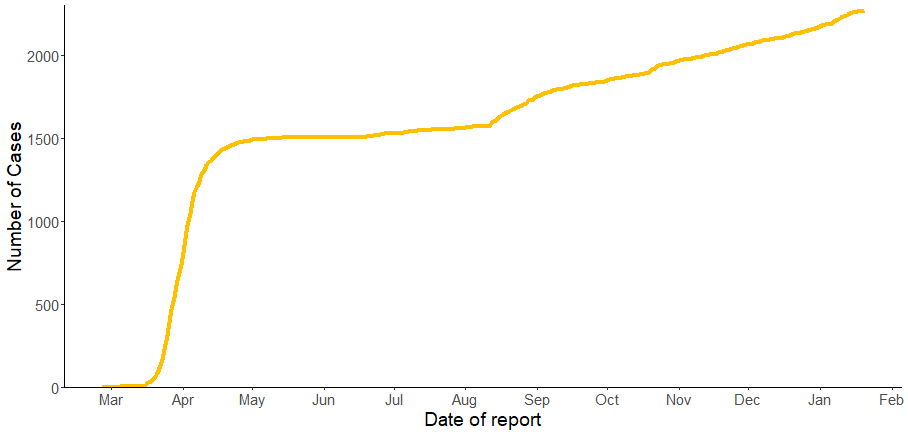
Total confirmed and probable cases
This graph shows the daily reported confirmed and probable cases of COVID-19 since the first New Zealand case in late February 2020. The number of new cases peaked in late March when the country went into Alert Level 4 on 25 March and started to go down in mid-April. By 20 April, there were less than ten cases reported per day and after 1 May less than five per day. There was a resurgence of community transmission in August and September 2020 associated with the Auckland August cluster. Throughout, the confirmed cases have outnumbered the probable cases.
Daily confirmed and probable cases
This graph shows the count of all cases of COVID-19 every day (all cases – active, recovered and deceased) since the first New Zealand case in late February 2020. The graph shows the rapidly increasing number of cases day-by-day from late March until the rate slowed through April as the restrictions during Alert Levels 4 and 3 took hold. The number of active cases increased rapidly until mid-April, peaked in early-April during Alert Level 4, and then decreased to low levels of active cases remaining each day from late-May, mainly at the border isolation facilities. Cases increased again from mid-August due to the Auckland August cluster.
COVID-19 by location
Total cases by DHB
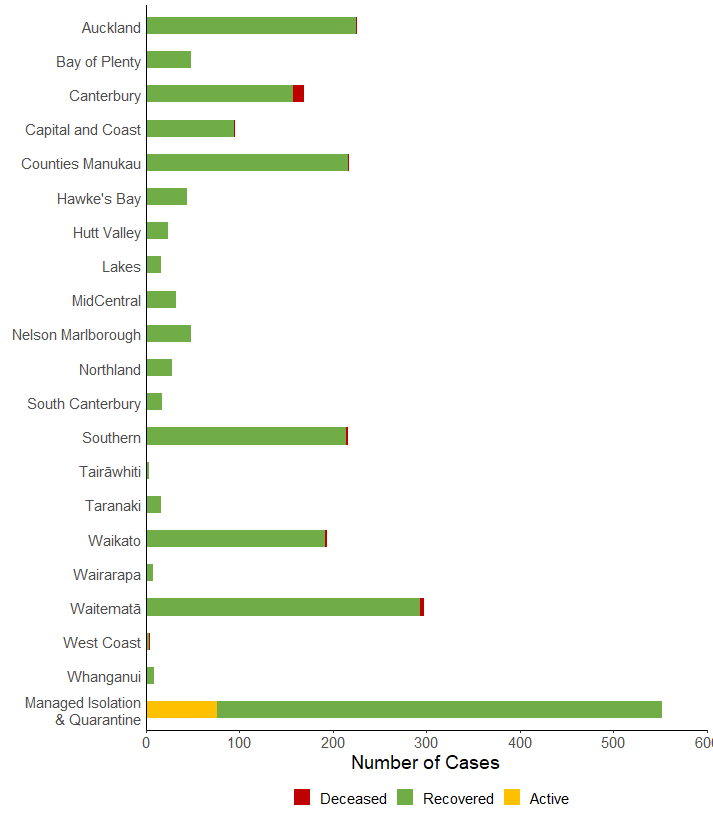
This bar graph shows the total cases and their status by District Health Board (DHB) and in managed isolation and quarantine facilities.
The Managed Isolation and Quarantine data group shows the number of cases in managed isolation or quarantine facilities. They are not included in the DHB totals. Before 17 June, people in managed isolation or quarantine facilities were included in the total of the relevant DHB.
Managed isolation and quarantine facilities are located in Auckland (Auckland DHB), Hamilton (Waikato DHB), Rotorua (Lakes DHB), Wellington (Capital and Coast DHB) and Christchurch (Canterbury DHB).
| Location | Active | Recovered | Deceased | Total | Change in last 48 hours |
|---|---|---|---|---|---|
| Auckland | 0 | 225 | 1 | 226 | -1 |
| Bay of Plenty | 0 | 48 | 0 | 48 | 0 |
| Canterbury | 0 | 157 | 12 | 169 | 0 |
| Capital and Coast | 0 | 94 | 2 | 96 | 0 |
| Counties Manukau | 0 | 216 | 1 | 217 | 1 |
| Hawke’s Bay | 0 | 44 | 0 | 44 | 0 |
| Hutt Valley | 0 | 24 | 0 | 24 | 0 |
| Lakes | 0 | 16 | 0 | 16 | 0 |
| Mid Central | 0 | 32 | 0 | 32 | 0 |
| Nelson Marlborough | 0 | 49 | 0 | 49 | 0 |
| Northland | 0 | 28 | 0 | 28 | 0 |
| South Canterbury | 0 | 17 | 0 | 17 | 0 |
| Southern | 0 | 214 | 2 | 216 | 0 |
| Tairāwhiti | 0 | 4 | 0 | 4 | 0 |
| Taranaki | 0 | 16 | 0 | 16 | 0 |
| Waikato | 0 | 192 | 2 | 194 | 0 |
| Wairarapa | 0 | 8 | 0 | 8 | 0 |
| Waitematā | 0 | 293 | 4 | 297 | 0 |
| West Coast | 0 | 4 | 1 | 5 | 0 |
| Whanganui | 0 | 9 | 0 | 9 | 0 |
| Managed Isolation & Quarantine | 76 | 476 | 0 | 552 | 5 |
| Total | 76 | 2166 | 25 | 2267 | 5 * |
* Even though there are 6 new cases today, the total number of cases is only increasing by 5. This is because 1 previously reported case is no longer being considered as a COVID case.
Note: we cannot give detailed information about cases in your district, city or town, as we must protect the privacy of the people concerned.