Last updated 2.00 pm, 23 April 2020.
We’ll be updating this page as new information is available.
On this page:
Summary
| Total | Change in last 24 hours | |
|---|---|---|
| Number of confirmed cases in New Zealand | 1,112 | -1 |
| Number of probable cases | 339 | 1 |
| Number of confirmed and probable cases | 1,451 | 0 |
| Number of cases currently in hospital | 8 | -3 |
| Number of recovered cases | 1,065 | 29 |
| Number of deaths | 16 | 2 |
Notes:
- Note: Three confirmed cases reported yesterday have been reclassified as under investigation to allow checks on whether they were counted in Uruguay’s case total before arrival in New Zealand. This is to prevent double counting by the World Health Organization. We had two new confirmed cases in the past 24 hours, making a total decrease of 1 case today.
View details of confirmed and probable cases.
View details of significant COVID-19 clusters.
View interactive map and dashboard.
Total cases by DHB
As at 9.00 am, 23 April 2020


| DHB | Active | Recovered | Deceased | Total | Change in last 24 hours |
|---|---|---|---|---|---|
| Auckland | 37 | 149 | 186 | -1 | |
| Bay of Plenty | 14 | 33 | 47 | 0 | |
| Canterbury | 55 | 94 | 9 | 158 | 3 |
| Capital and Coast | 29 | 64 | 2 | 95 | 0 |
| Counties Manukau | 17 | 94 | 111 | -3 | |
| Hawke’s Bay | 16 | 26 | 42 | 0 | |
| Hutt Valley | 5 | 15 | 20 | 0 | |
| Lakes | 4 | 12 | 16 | 0 | |
| Mid Central | 2 | 29 | 31 | 0 | |
| Nelson Marlborough | 6 | 42 | 48 | 0 | |
| Northland | 12 | 15 | 27 | 0 | |
| South Canterbury | 9 | 7 | 16 | 0 | |
| Southern | 26 | 188 | 2 | 216 | 0 |
| Tairāwhiti | 1 | 3 | 4 | 0 | |
| Taranaki | 2 | 12 | 14 | 0 | |
| Waikato | 71 | 114 | 1 | 186 | 1 |
| Wairarapa | 0 | 8 | 8 | 0 | |
| Waitematā | 62 | 149 | 1 | 212 | 0 |
| West Coast | 0 | 4 | 1 | 5 | 0 |
| Whanganui | 2 | 7 | 9 | 0 | |
| Total | 370 | 1065 | 16 | 1451 | 0 |
Total cases in hospital by DHB
| DHB | Total cases |
|---|---|
| Auckland | 4 |
| Bay of Plenty | 1 |
| Counties Manukau (Middlemore) | 1 |
| South Canterbury | 1 |
| Waitematā | 1 |
| Total | 8 |
Note: One of the 8 in hospital is in ICU as at 9:00am 23 April 2020
The above count excludes the five patients in Waitakere Hospital who have been moved from their aged residential care facility due to staffing issues.
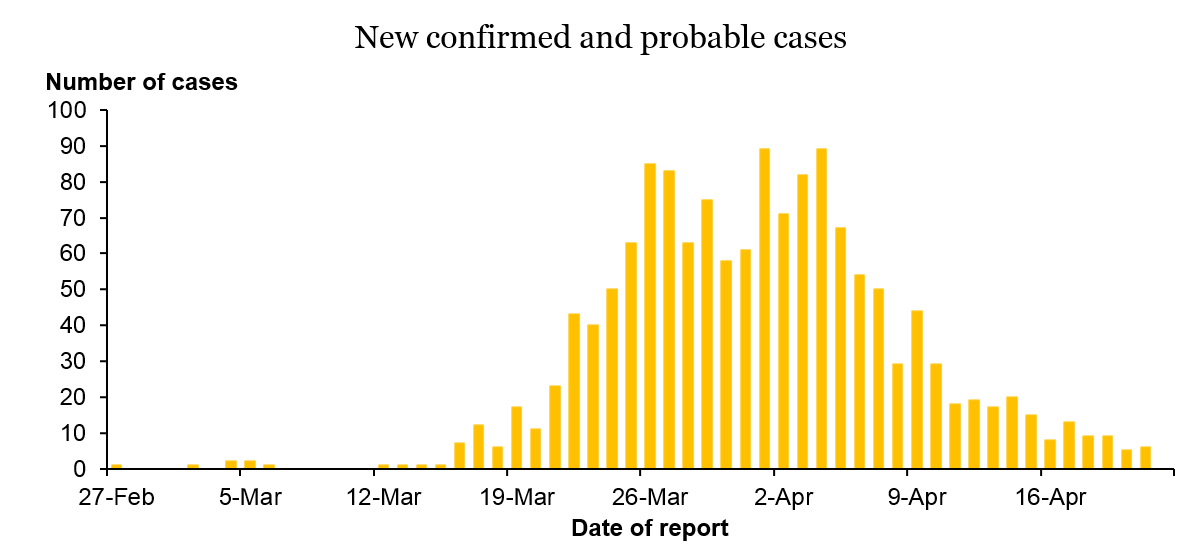
Epidemic curve

Total cases by age and gender

| Age Group | Active | Recovered | Deceased | Total | |
|---|---|---|---|---|---|
| 0 to 9 | 20 | 14 | 34 | ||
| 10 to 19 | 21 | 93 | 114 | ||
| 20 to 29 | 48 | 301 | 349 | ||
| 30 to 39 | 61 | 158 | 219 | ||
| 40 to 49 | 52 | 159 | 211 | ||
| 50 to 59 | 71 | 168 | 239 | ||
| 60 to 69 | 48 | 123 | 1 | 172 | |
| 70+ | 49 | 49 | 15 | 113 | |
| Total | 370 | 1065 | 16 | 1451 | |

Total cases by ethnicity

Note: A person who identifies with more than one ethnic group is allocated to a single ethnic group in the following order of priority: Maori, Pacific, Asian and European/Other.
For a detailed break down of ethnicity and DHB region testing see Testing by region.
Transmission
This information refers to the 1,451 confirmed and probable cases as at 9.00 am 23 April 2020.
| Transmission type | % of cases |
|---|---|
| Contact with known case | 56% |
| Recent overseas travel | 39% |
| Community transmission | 4% |
| Source under investigation | 2% |
Lab testing and capacity
| Lab Testing | Tests | Date |
|---|---|---|
| Total tested yesterday | 6,480 | 22 April 2020 |
| 7-day rolling average | 4,445 | 16 April to 22 April 2020 |
| Total tested to date | 101,277 | 22 January to 22 April 2020 |
| Supplies in stock | 84,659 | 23 April 2020 |
Source: ESR EpiSurv extract as at 09:00 23 April 2020
For a detailed break down of ethnicity and DHB region testing see Testing by region.


| Date | Tests per day | Total tests (cumulative) |
|---|---|---|
| 22 Jan – 8 Mar | 300 | |
| 9-Mar | 12 | 312 |
| 10-Mar | 89 | 401 |
| 11-Mar | 83 | 484 |
| 12-Mar | 31 | 515 |
| 13-Mar | 35 | 550 |
| 14-Mar | 34 | 584 |
| 15-Mar | 142 | 726 |
| 16-Mar | 325 | 1051 |
| 17-Mar | 659 | 1710 |
| 18-Mar | 1209 | 2919 |
| 19-Mar | 1291 | 4210 |
| 20-Mar | 1554 | 5764 |
| 21-Mar | 1176 | 6940 |
| 22-Mar | 1256 | 8196 |
| 23-Mar | 1050 | 9246 |
| 24-Mar | 1544 | 10790 |
| 25-Mar | 2592 | 13382 |
| 26-Mar | 2117 | 15499 |
| 27-Mar | 2067 | 17566 |
| 28-Mar | 1809 | 19375 |
| 29-Mar | 918 | 20293 |
| 30-Mar | 1391 | 21684 |
| 31-Mar | 2093 | 23777 |
| 1-Apr | 2562 | 26339 |
| 2-Apr | 3446 | 29785 |
| 3-Apr | 3631 | 33416 |
| 4-Apr | 3093 | 36509 |
| 5-Apr | 3709 | 40218 |
| 6-Apr | 2908 | 43126 |
| 7-Apr | 4049 | 47175 |
| 8-Apr | 3990 | 51165 |
| 9-Apr | 4520 | 55685 |
| 10-Apr | 3061 | 58746 |
| 11-Apr | 2421 | 61167 |
| 12-Apr | 1660 | 62827 |
| 13-Apr | 1572 | 64399 |
| 14-Apr | 2100 | 66499 |
| 15-Apr | 3661 | 70160 |
| 16-Apr | 4241 | 74401 |
| 17-Apr | 4677 | 79078 |
| 18-Apr | 4146 | 83224 |
| 19-Apr | 3081 | 86305 |
| 20-Apr | 3203 | 89508 |
| 21-Apr | 5289 | 94797 |
| 22-Apr | 6480 | 101,277 |
Note: Two sets of cumulative test data have been reconciled to give cumulative total from 22 January 2020 when testing began.