Last updated 1:00 pm, 9 April 2020.
We’ll be updating this page as new information is available.
On this page:
Summary
| Total to date | New in last 24 hours | |
|---|---|---|
| Number of confirmed cases in New Zealand | 992 | 23 |
| Number of probable cases | 247 | 6 |
| Number of confirmed and probable cases | 1,239 | 29 |
| Number of cases in hospital | 14 | 2 |
| Number of recovered cases | 317 | 35 |
| Number of deaths | 1 |
View full details of the confirmed cases.
View details of significant COVID-19 clusters.
View interactive map and dashboard.
View interactive map and dashboard.
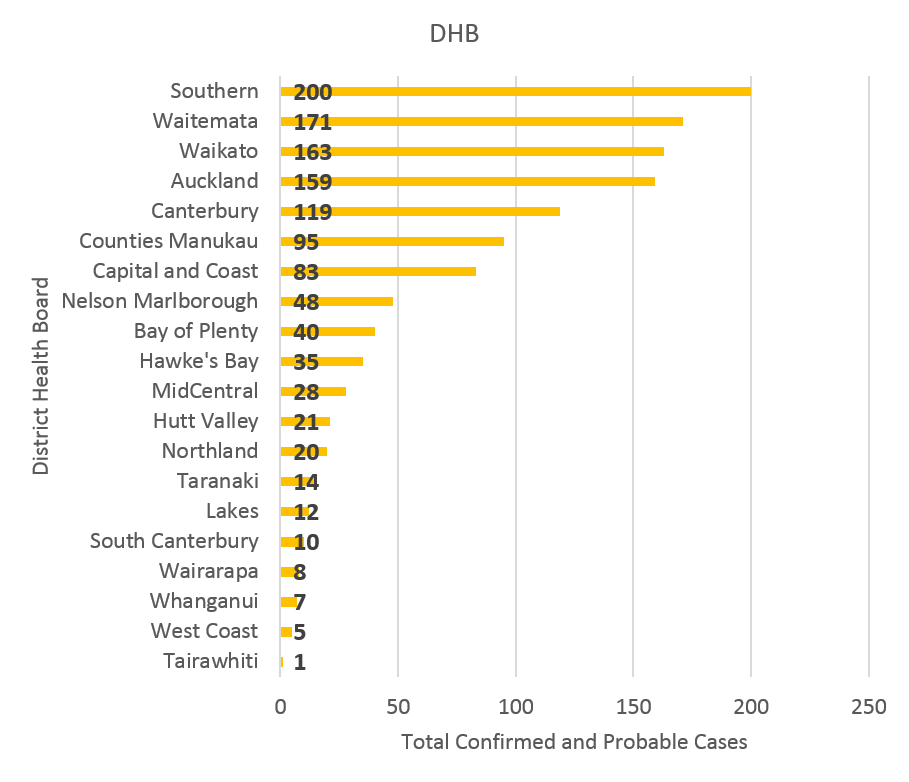
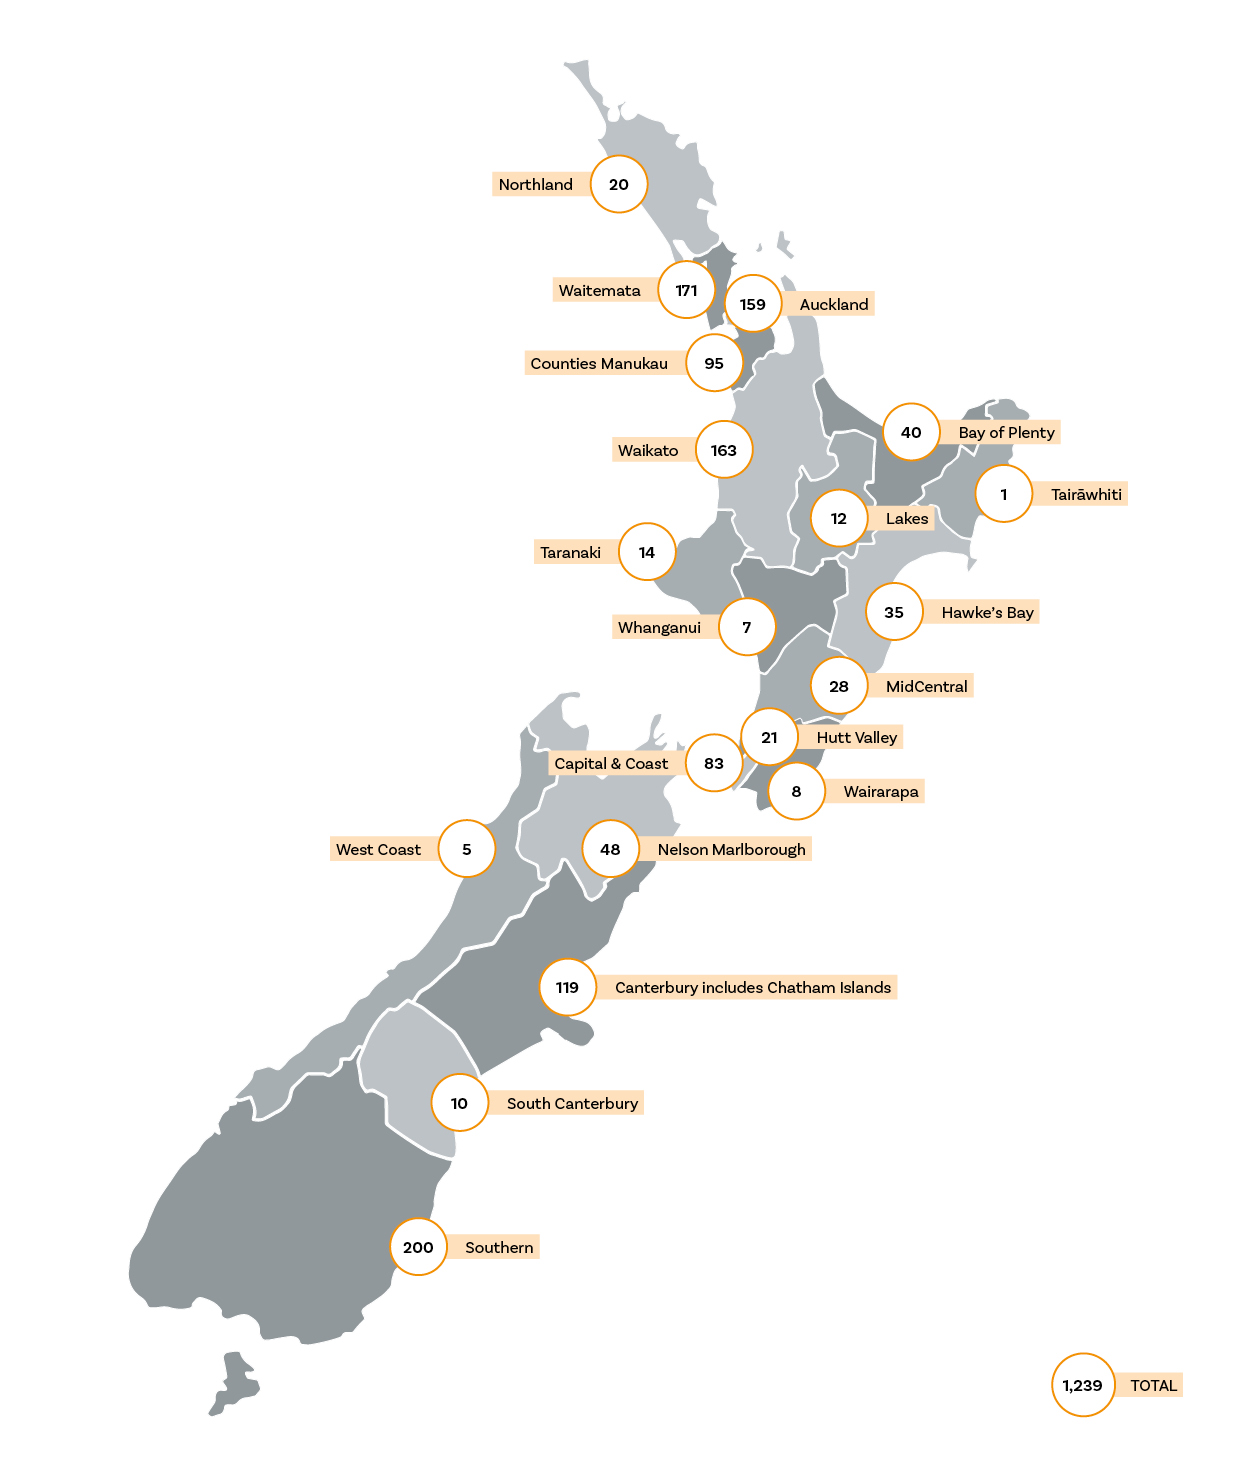
Total cases by DHB
As at 9.00 am, 9 April 2020
| DHB | Number of cases | Change in last 24 hours |
|---|---|---|
| Auckland | 159 | 4 |
| Bay of Plenty | 40 | 2 |
| Canterbury | 119 | 5 |
| Capital and Coast | 83 | 1 |
| Counties Manukau | 95 | 3 |
| Hawke’s Bay | 35 | 0 |
| Hutt Valley | 21 | 0 |
| Lakes | 12 | 0 |
| MidCentral | 28 | 0 |
| Nelson Marlborough | 48 | 2 |
| Northland | 20 | 0 |
| South Canterbury | 10 | 0 |
| Southern | 200 | 5 |
| Tairāwhiti | 1 | 0 |
| Taranaki | 14 | 0 |
| Waikato | 163 | 4 |
| Wairarapa | 8 | 0 |
| Waitemata | 171 | 2 |
| West Coast | 5 | 1 |
| Whanganui | 7 | 0 |
| Total | 1239 | 29 |
Total cases in hospital by DHB
| DHB | Total cases |
|---|---|
| Auckland | 2 |
| Canterbury | 1 |
| Capital & Coast (Wellington) | 2 |
| Counties Manukau (Middlemore) | 2 |
| South Canterbury | 1 |
| Southern (Lakes District, Dunedin & Southland) | 3 |
| Waikato | 1 |
| Waitemata | 2 |
| Total | 14 |
Note: Four of the 12 in hospital are in ICU.
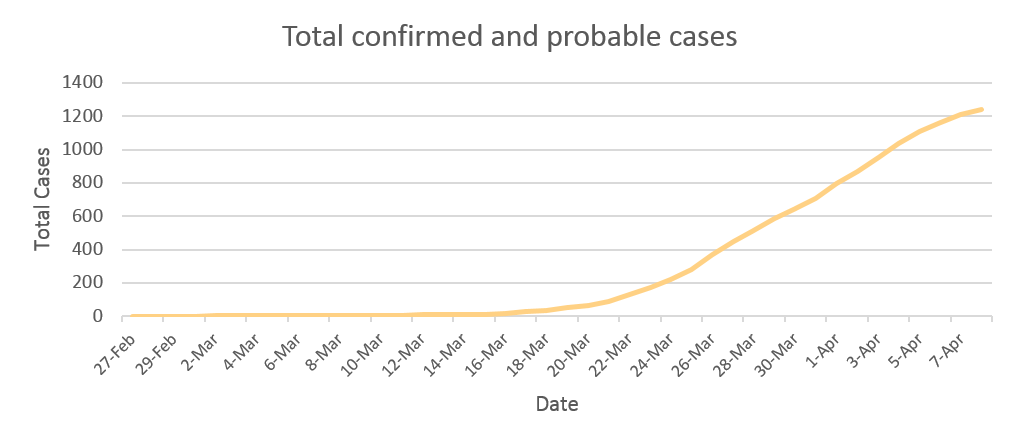
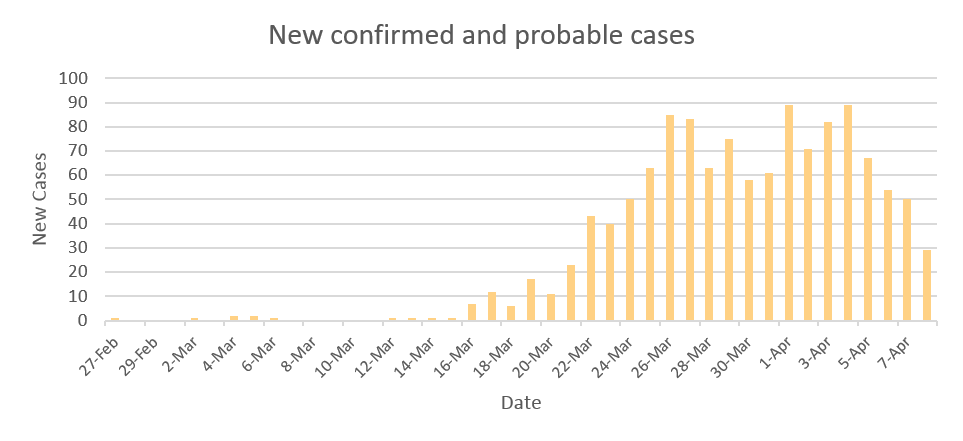
Epidemic curve
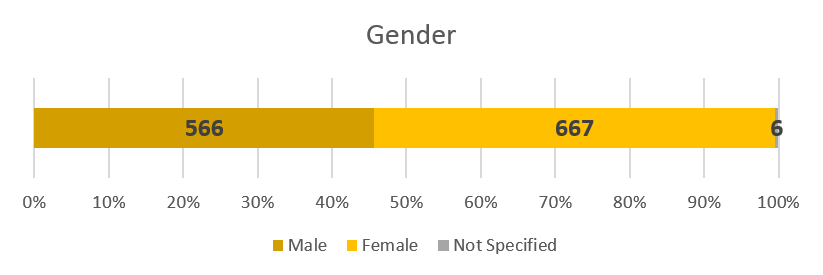
Total cases by age and gender

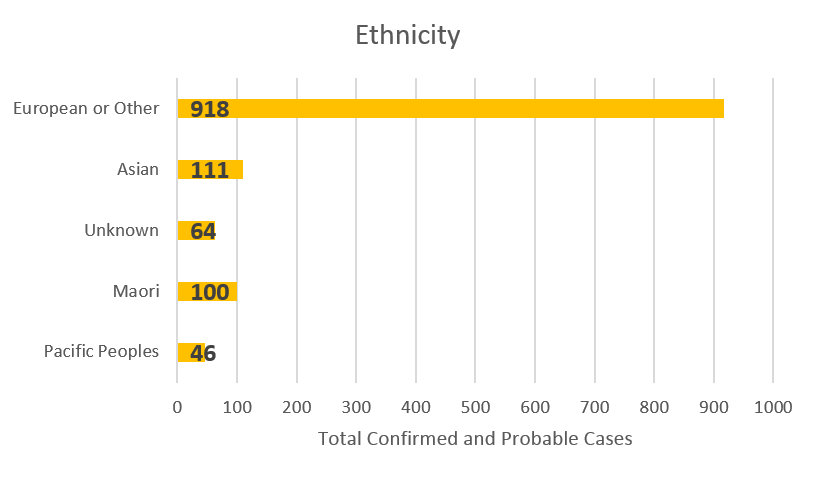
Total cases by ethnicity
Transmission
This information refers to the 1,210 confirmed and probable cases as at 9.00 am 9 April 2020.
| Transmission type | % of cases |
|---|---|
| Recent overseas travel | 41% |
| Contact with known case | 44% |
| Community transmission | 2% |
| Source under investigation | 13% |
Lab testing
| Lab Testing | Tests | Date |
|---|---|---|
| Total tested yesterday | 3,990 | 8 April 2020 |
| 7-day rolling average | 3,547 | 2 to 8 April 2020 |
| Total tested to date | 51,165 | 22 January to 8 April 2020 |
| Supplies in stock | 47,056 | 9 April 2020 |
Note: Two sets of cumulative test data have been reconciled to give cumulative total from 22 January 2020 when testing began.
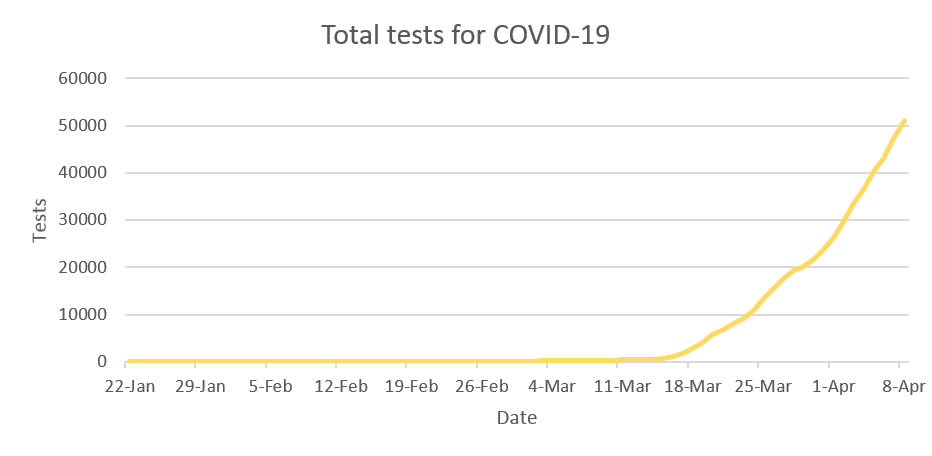
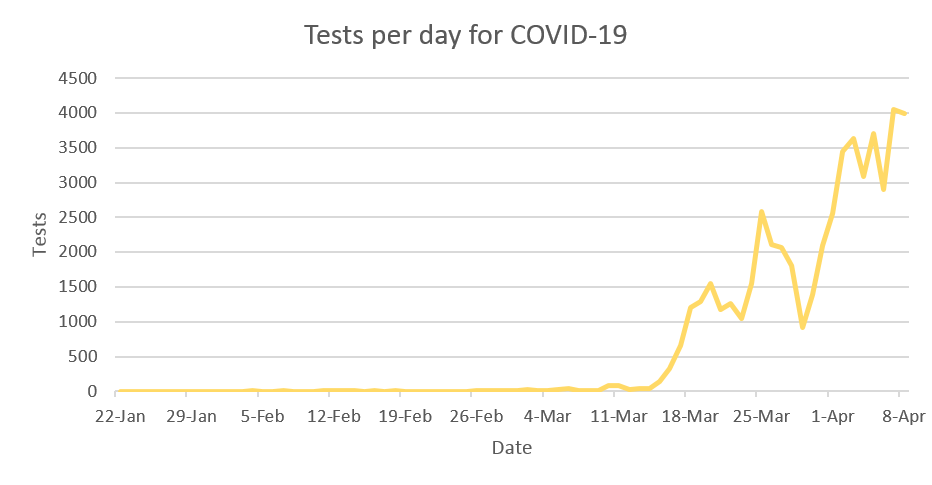
| Date | Tests per Day | Total Tests (Cumulative) |
|---|---|---|
| 22 Jan – 8 Apr | 300 | |
| 9-Mar | 12 | 312 |
| 10-Mar | 89 | 401 |
| 11-Mar | 83 | 484 |
| 12-Mar | 31 | 515 |
| 13-Mar | 35 | 550 |
| 14-Mar | 34 | 584 |
| 15-Mar | 142 | 726 |
| 16-Mar | 325 | 1051 |
| 17-Mar | 659 | 1710 |
| 18-Mar | 1209 | 2919 |
| 19-Mar | 1291 | 4210 |
| 20-Mar | 1554 | 5764 |
| 21-Mar | 1176 | 6940 |
| 22-Mar | 1256 | 8196 |
| 23-Mar | 1050 | 9246 |
| 24-Mar | 1544 | 10790 |
| 25-Mar | 2592 | 13382 |
| 26-Mar | 2117 | 15499 |
| 27-Mar | 2067 | 17566 |
| 28-Mar | 1809 | 19375 |
| 29-Mar | 918 | 20293 |
| 30-Mar | 1391 | 21684 |
| 31-Mar | 2093 | 23777 |
| 1-Apr | 2562 | 26339 |
| 2-Apr | 3446 | 29785 |
| 3-Apr | 3631 | 33416 |
| 4-Apr | 3093 | 36509 |
| 5-Apr | 3709 | 40218 |
| 6-Apr | 2908 | 43126 |
| 7-Apr | 4049 | 47175 |
| 8-Apr | 3990 | 51165 |
Note: Two sets of cumulative test data have been reconciled to give cumulative total from 22 January 2020 when testing began.